Showing posts with label Markets. Show all posts

Saturday, December 31, 2011

Year End Market Analysis


Once again SP-500 is lingering near 1260 zone. This zone is a significant zone because 200 day SMA is right around 1258. It is also the point where the index meets the downtrend line(resistance line) connecting the recent market tops resulting into a coiling pattern.

This is the fourth time since October that SP-500 has tried to break this level.  During the last few tries it has failed failed miserably, and to add to the misery it resulted in fast paced sharp dagger declines back towards the uptrend support line that connects recent market lows. So as soon as market reaches these levels, lot of institutional bears along with retail bear crowd come out and go short, pulling the market down and that is exactly what we are seeing. SP-500 was trading slightly above the 200-day SMA and the the downtrend line but on Friday close, it went a bit negative below 200 day SMA. Hence we cannot say with confidence that we have a breakout. Also the NYSE volume was not there during the holiday week to give it more convincing look either.


However, a breakout  accompanied by volume, leading sectors (XBD, SOX and IYT)  would provide lot of convincing power.
Breadth indicators ( the one I follow is developed by Pradeep Bonde ) has been less supportive of this up move and has been like that whole year around.  The current rallies from oversold levels  on SP-500, from mid-December to now, had a strong breadth reading on 20th December but there was no follow through. We would like to see the Breadth numbers getting hammered out of the park on next consecutive days. This is a negative divergence and is giving a warning that upside breakout might be a fakeout.  So we will keep a close eye on these numbers also. 

The Volatility index mighty VIX has been declining steadily since October. This it self is a bullish signature. VIX below 150 day MA is usually bullish and we have been seeing rallies. From the above picture of VIX you can see that VIX is trading below its long term MA. Even during the recent sell off on Thursday, it did not cross its 20 day MA which is acting like a resistance now. 
As pointed out earlier, I have been watching the VX futures on CFE exchange  also to see the direction of VIX options. The VIX futures VX are trading  at lot higher prices than VIX itself. 
i.e  The institutional or smart money traders are worried about Euro crisis and Market tumbles and hence they been buying protection in the form of SP-500 puts and/or VIX futures or VIX calls. This basically has caused the price of VX futures (VIX calls and puts are hedged by its futures as there is no outright buying or selling of VIX index)
One should be worried about this type of setups as Smart monies are usually right. But again we let the Markets tell us and then we follow rather than taking a outright stand. One can take a outright stand and that can be very profitable but you need protective stops just in case you are wrong.
Our trusty indicator $BPNYA is also on buy side as of now. The RSI indicator with $BPNYA is usually telling a sign when $BPNYA is getting frothy or getting flattened out

As many of you know that I don't to get into any market prediction business but I expect markets to give you  an overall 11% that historically it has been giving you. There will be lots of up and downs in the year and those are hard to predict but those up and downs are the opportunity times and that is where we have an edge and excel.  
Avoid bad periods or even go short and then when the market turns we go bullish. So I believe achieving 20% returns safely is still possible and is the goal for this year. 
I am closing this year with 54.17% returns in ETF portfolio (join the bigbullbigbear team), nice 31.18% in 401k portfolio.
Adios 2011 and Wish you all Happy New 2012.


Wednesday, September 14, 2011

Tell-Tale Sign today

Today, the futures are positive so I expect VIX to drop sharply, if it does not then remain defensive and any sign of weakness bail out.

The reason for this is VIX is stubbornly sticking above 32 levels and the VIX futures all the way upto December are showing a bearish tint.  Today both has to adjust with markets moving up, if they dont then we have another down wave on the horizon. 

Wednesday, September 7, 2011

Waiting for Longer term setup

As I said today, this is not a good time to deploy long term capital. Yes for short term bear rallies, you can deploy very strategically and bail out with profits or small losses but for longer term account, patience pays at this junction.


You want VIX to come down to 25 levels and cross below its 150 day MA. If you go back and study most of the rallies have started when VIX crossed its 150 day MA.

So patience is the name of the game. We will soon have our way.. 

Tuesday, August 9, 2011

Train Wreck and Waiting for Clean up Crew and Offense team.

Now the train wreck has decimated everything except for Gold. We should be patient here to wait for the uptown express to arrive. Also watch out you gold bugs, this is very crowded trade ready to fall off the cliff. So tighten your stops if you are long Gold.

Looking at the NYSE bullish percent Index numbers, we can see that we have gone from one goal post (80 levels) to another goal post (30 levels). Bulls scored the goal to 80 and now bears have made their goal by hitting the goal (30 levels).


Dorsey in his book Point and Figure charting explained how to read this Bullish percent Index chart..
*****************************************************************

The chart above is similar to football play.  This chart is my way of demonstrating how we view the
market as a football game where the play shifts from offense to defense throughout the game.

 The first thing an investor must know before investing any money is whether the offensive team or defensive team is on the field.In a football game, two forces operate on the field at any one time, offense and defense. The same forces act in the marketplace. There are times when the market is supporting higher prices and times when the market is not supporting higher prices. When the market is supporting higher prices, you have possession of the ball. You have the offensive team on the field. When you have the ball, your job is to take as much money away from the market as possible; this is when you must try to score. During times when the market is not supporting higher prices, you have in essence lost the ball  and must put the defensive team on the field. During such periods, the market’s job is to take as much money away from you as possible.

Think for a moment about your favorite football team. How well would they do this season if they operated with only the offensive team on the field in every game? They might do well when they had possession of the ball, but when the opposing team had the ball, your team would be scored on at will. The net result is your season would be lackluster at best. This is the problem most investors have. They don’t know where the game is being played, much less which team is on the field. Let’s face it, most American investors only buy stocks, they never sell short. The market is fair.

It has something for everyone. It goes up and it goes down. The NYSE Bullish Percent signals when the environment is ripe for offense or defense. I want to stress that there is a time to play offense and a time to play defense. You must know which is which.
*************************************************************************

Monday, March 14, 2011

They also serve who Stand and Wait

Last week's post on Capital Preservation is still in place.  I am still not ready to get back in the water.

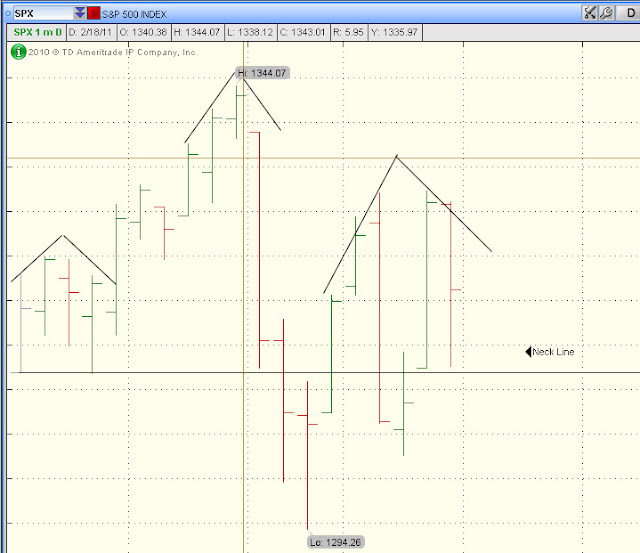
As posted last week, I will only get in after I see an end to that nasty Head and Shoulders pattern. Looks to me this pattern is working for bears. But we remain patient and then try to get in.


The first neck line is now broken as you can see from the above chart.


Saturday, March 5, 2011

Capital Preservation Mode, Death by Thousand Cuts Markets


Some time I go I had posted some of the charts I like to monitor for Bear prowls and how to protect ourselves from the distress it causes to our hearts and our portfolios. I am currently sitting on cash with some small positions in stocks. 

We review those same things again


These are some of the charts that I like to use to time the market along with some other indicators


Another pattern that is developing is the nasty Head and shoulders pattern in SPX chart.


If this pattern does not really come into play then we are looking at an explosive move up. But till we Mr. Markets shows us his hand, we sit on hands and be in the Capital Protection mode.

Monday, February 28, 2011

Waiting for Clear Direction

No Trades this week. Markets are in some kind of turmoil. I am expecting a move downwards on this bearish bounce.

It would be better for overall market if SPX moves down to 1286 area (50 day Simple Moving Avg) to clear all the excess to start a new wave up.

Till market gives a clear signal, please hold on your bullets and preserve the ammo and health.

I will post in between if market gives a buy signal.


Thursday, October 21, 2010

TUG OF WAR


The markets were again rescued by the FED helicopters and High Frequency Computers.

The bulls tried to take the markets up this morning breaking the 1184 levels on SP-500 and then Bears came back and took it down. The HFT computers were favoring the Bears this afternoon.

Again after 2.00 pm, the HFT computers changed sides and started supporting Bulls..


Here is another picture that shows what needs to happen for us to become BULLS again. Also remember we are not BEARS either as of now..


Sunday, May 16, 2010

Where is market heading?

We had a big rally since Feb 2010. Market was up almost 12% at time without any profit taking. Since starting of May, the institutions started taking profits and hence the market was expected to go down..

This was coupled with couple of Scary Boos..
1) Greece Debt - Chances that Euro will discarded as money making EU nations might pullout of Euro..
2) Unusual usage of Derivative esp. e-Mini futures by hedge fund
3) NYSE not able to keep up with orders and other stock exchanges going around NYSE and having markets go down 1000 points..

Techically, the markets have broken the uptrend and along with all the scary boos.. Overall market is gyrating downwards..

Fundamentally, companies are strong...., Last year's economic depression have made companies lean, hence we are seeing double punches.. Revenue # are up and operating expenses have been trimmed down.. So final #s, EPS are above the normal figures. .and will continue as we are seeing the GDP grow towards 3%...

This is good time to get into fundamentally strong companies like Apple, Oracle, Cisco, Proctor and Gamble etc(look for operating #s above debt). Also the High dividend yielders are a overall good choice.